
Original data(Answer)
You can download original data(answer) from Data.zip.
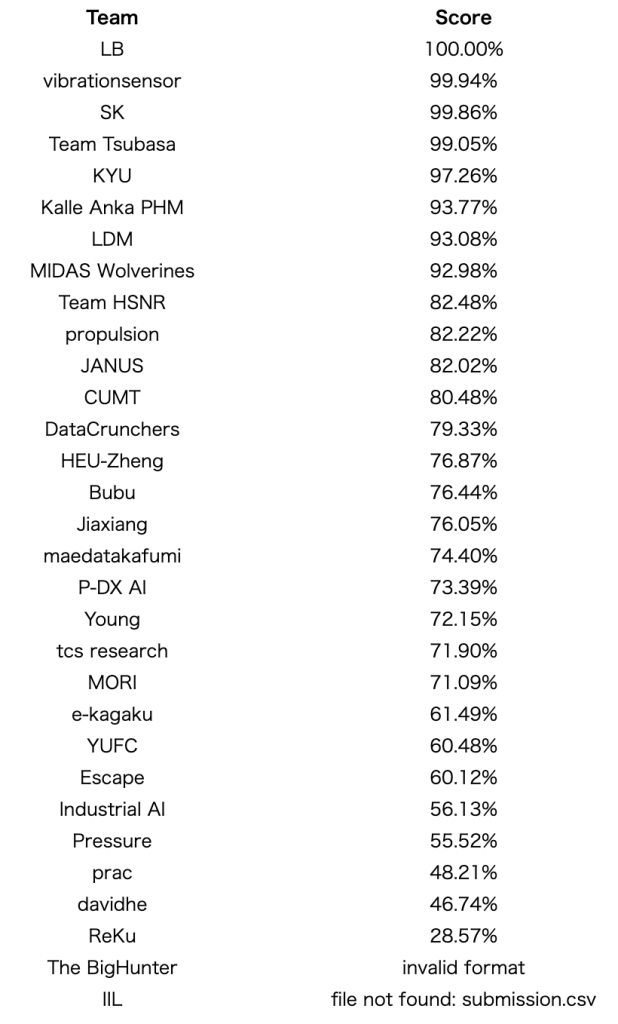
Final Evaluation Result
Winner
- 1st place: LB
- 2nd place: vibrationsensor
- 3rd place: Team Tsubasa
The fourth-place, “Team Tsubasa” was promoted to a prize-winning position as the third-place “SK” can’t attend the conference.
Thank you for your participation in our Data Challenge!
1. Introduction
Japan Aerospace Exploration Agency (JAXA) aims to improve PHM technology for spacecraft propulsion systems. Telemetry data that can be acquired in orbit is limited due to the limitation of sensor installations and downlink capacity. A numerical simulator to predict the dynamic response of a spacecraft propulsion system with high accuracy has been studied to generate a dataset covering normal conditions and all anticipated fault scenarios in actual equipment.
2. Competition Objectives
Improve PHM technology for next-generation spacecraft by diagnosing normal, bubble anomalies, solenoid valve faults, and unknown abnormal cases using data generated by a simulator for a simplified propulsion system developed with the cooperation of JAXA.
3. Experiment Scenarios
Figure 1 shows an experimental propulsion system. The working fluid is water pressurized to 2 MPa and discharged through four solenoid valves (SV1 – SV4) simulating thrusters. P1 – P8 shows the pressure sensor and time series data is obtained at a sampling rate of 1 kHz from 0-1200 ms. By opening and closing the solenoid valves, pressure fluctuation is observed due to the water hammer followed by acoustic modes inside the propulsion system.
Typical time series data is shown in Fig. 2. The solenoid valve opens at 100 ms and closes at 300 ms. To account for individual differences of solenoid valve appearing in actual equipment, the valve movement has an uncertainty of 1 ms. The opening and closing times remain at 400 ms, even with the uncertainty (e.g., open for 99.7 ms and close for 300.3 ms). This sequence is conducted three times successively, resulting in a total measurement of 1200 ms.
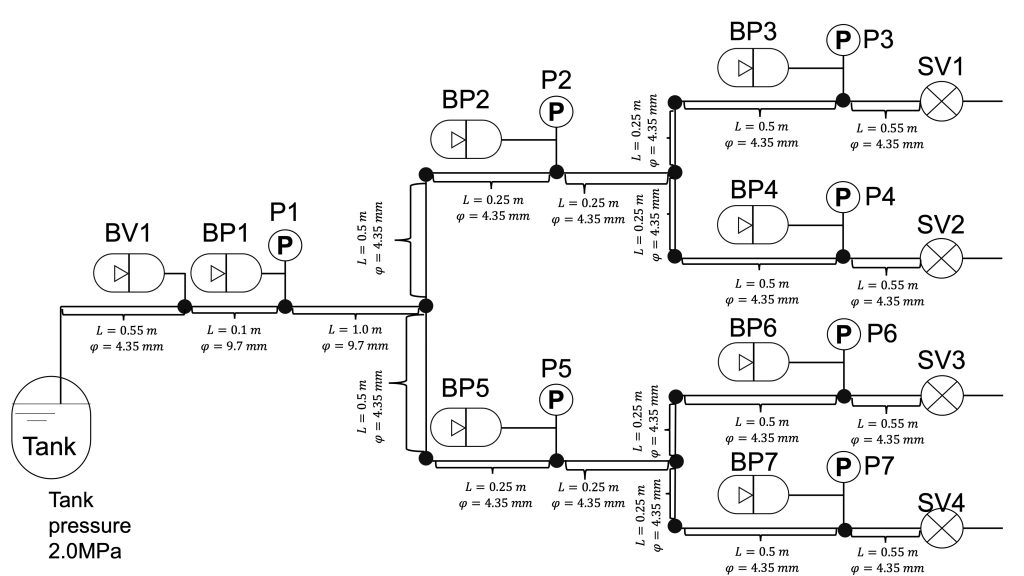
Fig. 1 Schematic of experimental propulsion system.
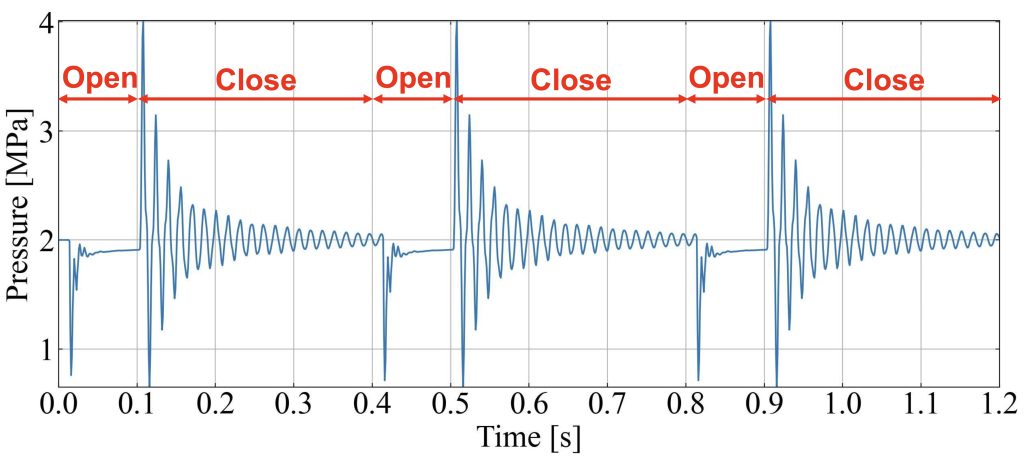
Fig. 2 Typical pressure profile.
In this competition, anomalies due to bubble contamination and fault due to the abnormal opening of the solenoid valve are considered. Moreover, an unknown anomaly is included in the test data.
Bubble anomaly: Air bubbles occasionally appear in the pipes during the actual operation of a spacecraft. The existence of bubbles changes the speed of sound, causing slight changes in the pressure fluctuations. It is desirable to detect the appearance of bubble and their location.
- There are eight possible locations, BV1 and BP1 to BP7 as shown in Fig.1.
- The amount of bubbles contaminated in the propulsion system is constant in all cases for simplicity.
Solenoid valve faults: This is one of the major failure modes in spacecraft propulsion systems. It is required to find which solenoid valves failed and their opening ratio.
- Solenoid valves open and close at the opening ratio of 100% and 0%, respectively.
- In case of faults, solenoid valves open at a degree between 0% and 100%, which results in a reduced volume of fluid through the solenoid valve.
Unknown anomaly: In the practical operation, completely unforeseen and unknown anomalies or faults may occur. It is also required to distinguish unknown anomalies without confusing them with known anomalies and faults. Some unknown anomalies or faults are mixed in the test data. Identifying them is also part of the task in this competition.
Individual differences in spacecraft: Since solenoid valves have individual differences, such as the timing of opening and closing, time series data acquired from the spacecraft propulsion system show differences, which in turn lead to individual differences in the spacecraft. In this competition, four spacecraft (No.1 to 4) are considered. Results for the three of them, No.1 to No.3, are included in the training data, but test data is composed of the results for No.1 and No.4.
4. Prediction Goals
- Determine normal or abnormal for all test data.
- For the data detected as abnormal, determine if it is an anomaly due to bubble contamination, solenoid valve fault, or unknown fault.
- For the data identified as bubble contamination, determine the location of the bubble from eight locations, BV1, and BP1 to BP7.
- For the data identified as solenoid valve fault, determine which of the four solenoid valves (SV1 to SV4) failed.
- For the solenoid valve identified as a fault, predict the opening ratio. (0% <= Opening ration < 100%)
5. Data Contents
You can download the dataset here.
Data contents
├── dataset
│ ├── train
│ │ ├── data
│ │ │ └── Case1~177.csv
│ │ └── labels.xlsx
│ └── test
│ │ ├── data
│ │ │ └── Case178~223.csv
│ │ └── labels_spacecraft.xlsx
│ ├── submission.csv
│ └── readme.pdf
In each CSV file, the first column is time, and the remaining columns are pressure at the measurement points P1 – P7 as shown in Fig. 1.
5.1 Training Data
- Number of normal data for Spacecraft-1: 35
- Number of normal data for Spacecraft-2: 35
- Number of normal data for Spacecraft-3: 35
- Number of abnormal data for Spacecraft-1: 24
- Number of abnormal data for Spacecraft-2: 24
- Number of abnormal data for Spacecraft-3: 24
`labels.xlsx` describes detailed information on training data such as case name, spacecraft number, and experimental condition. Please note that there is no Spacecraft-4 data in the training data.
5.2 Test Data
- Number of data for Spacecraft-1: 23
- Number of data for Spacecraft-4: 23
`labels_spacecraft.xlsx` describes the information of case name and spacecraft number.
The opening ratio of the valve is randomly chosen between 0% and 100% in case of fault.
6. Evaluation Metrics
- Classification of normal/abnormal condition: 10 points
- For the data correctly detected as abnormal, classification of bubble contamination anomaly/solenoid valve fault/ unknown fault: 10 points
- For the data correctly identified as bubble contamination, identification of bubble location: 10 points
- For the data correctly identified as solenoid valve fault, identification of the failed valve: 10 points
- For the solenoid valve correctly identified as fault,, prediction of the opening ratio: max(-|truth – prediction|+20, 0)
For spacecraft-4, scores are doubled, considering the difficulty.
Please note that the score displayed in the evaluation is based on a randomly extracted dataset from the test data. There is a possibility that the final round scoring may differ from the leaderboard. Participants are permitted to submit their entries multiple times. Please note that each new submission will overwrite the previous one. Only the most recent submission at the time of scoring will be evaluated and its results displayed. Scoring occurs daily at 12:00 PM JST (3:00 AM UTC).
7. Submission Format
Submit results in a CSV file. You can find a template of submission in the dataset.
- Id: The ID of the test data
- Task 1: Input 0 for normal, 1 for abnormal condition.
- Task 2: For the abnormal conditions detected in task 1, input 1 for the unknown condition, 2 for the bubble anomaly, and 3 for the valve fault. Fill 0 for the rest of the cases.
- Task3: For the bubble anomalies detected in task2, 1 for bubbles in BP1, 2 for bubbles in BP2, 3 for bubbles in BP3, 4 for bubbles in BP4, 5 for bubbles in BP5, 6 for bubbles in BP6, 7 for bubbles in BP7, and 8 for bubbles in BV1. Fill 0 for the rest of the cases.
- Task 4: For the valve, fault detected in task 2, 1 for fault in SV1, 2 for fault in SV2, 3 for fault in SV3, and 4 for fault in SV4. Fill 0 for the rest of the cases.
- Task 5: Input the predicted opening ratio (Y) from 0 <= Y < 100. Fill 100 for the rest of the cases.
Additionally, the top three ranked teams will be requested to submit their winning papers within one month after the round is closed. The winning paper shall follow the format of the conference paper and discuss the algorithms and models as well as the analysis results and will be peer-reviewed. Submission of the winning paper is mandatory to receive an award.
8. Qualifications and Teams
The data challenge in PHMAP23 is a competition open to all potential attendees.
Collaboration is encouraged and teams can consist of students, researchers, and professionals from various industries, from single or multiple organizations. There is no requirement on team size (but having at least one member of a team).
9. Analysis Tools
Participants are encouraged to apply state-of-the-art algorithms and models to perform the regression and classification problems that happen in real-world industrial fields.

Thanks to our official sponsor MathWorks, participants can use complimentary software listed here:
| 1. | MATLAB | 10. | Wavelet Toolbox |
| 2. | MATLAB Test | 11. | Audio Toolbox |
| 3. | Parallel Computing Toolbox | 12. | DSP System Toolbox |
| 4. | Statistics and Machine Learning Toolbox | 13. | System Identification Toolbox |
| 5. | Deep Learning Toolbox | 14. | Econometrics Toolbox |
| 6. | Curve Fitting Toolbox | 15. | Symbolic Math Toolbox |
| 7. | Text Analytics Toolbox | 16. | Optimization Toolbox |
| 8. | Predictive Maintenance Toolbox | 17. | Global Optimization Toolbox |
| 9. | Signal Processing Toolbox |
To request the complementary license, please submit the form. You will soon receive an email with a URL where you can download MATLAB. In the process, you will be asked to create a MathWorks account.
10. Conditions for Winner
- The top three ranked teams will be awarded under the following conditions:
- Register and attend the PHMAP23 Conference.
- Submit a peer-reviewed conference paper discussing the algorithms and models as well as the analysis results.
- Present them at the conference on-site or online.
- Attend the award ceremony on-site or online.
The winning teams will be invited to present at a special session at the conference, and the prize will be awarded as follows:
- 1st place: USD 1,000
- 2nd place: USD 500
- 3rd place: USD 300
11. Schedule of Data Challenge
| Round Open | May 8, 2023 |
| Evaluation Open | May 30, 2023 |
| Round Closed & Submission Due | June 30, 2023 |
| Winner Announcement | July 5, 2023 |
| Winning Paper Submission Due | Aug 7, 2023 |
| Conference Dates | Sep 11-14, 2023 |
Good luck!